Next month StackOverflow will pass a catastrophic point in its history
I’ve used StackOverflow a lot. I’m not just talking about landing there from Google; I’ve been regularly participating for about four years. Since then I’ve answered about 1000 questions, mostly under the Java tag.
To the casual visitor, it probably seems like everything’s chugging along just fine. If you’re looking for an answer to something trivial – “How do I write to a file in Java?” – then StackOverflow will work just as well as it always has. Those questions have already been answered and, perhaps just as importantly, they’ve been indexed by Google.
But when you hit some obscure exception thrown by a library that no one else in your company has used, good luck getting an answer. StackOverflow is dying and it may be too late to do anything about it.
The number of people demanding answers has been steadily rising since the website’s inception. These new users aren’t willing to read the documentation; they don’t know it exists or how to find it. Some of them aren’t even prepared to google the answer. They’d rather type out an entire question, because of course they’re special snowflakes and their problem is utterly unique. They are absolutely the only person who’s ever needed to send an HTTP request.
StackOverflow started as a community of professionals, of equals coming together to solve one another’s problems in a public space for the benefit of everyone. The dynamic has shifted insidiously, and there’s now a noticeable divide between the people who are motivated and qualified to answer questions, and the people who want to ask them. What started as symbiotic has become parasitic, and that hasn’t escaped the attention of the hosts.
I realise that I’m ranting but the alternative is apathy and that’s worse. StackOverflow is one of the most important resources software developers have and it’s being allowed to languish by a leadership team without a plan for addressing the core problems. In fact, it seems like they don’t even recognise them. Instead, they’re content to make impotent modifications that won’t change anything.
Everything I’ve written so far has been my subjective personal experience so I wanted to pull some numbers to justify and rationalise my preconceived indignation. That’s something that a healthy and well-adjusted human being would do, isn’t it? … Well I’m doing it anyway.
StackExchange’s Data Explorer allows users to write SQL queries against a subset of the tables of their production database. I’ve written some queries to confirm my existing biases, and condensed them into everyone’s favourite data presentation format: graphs!
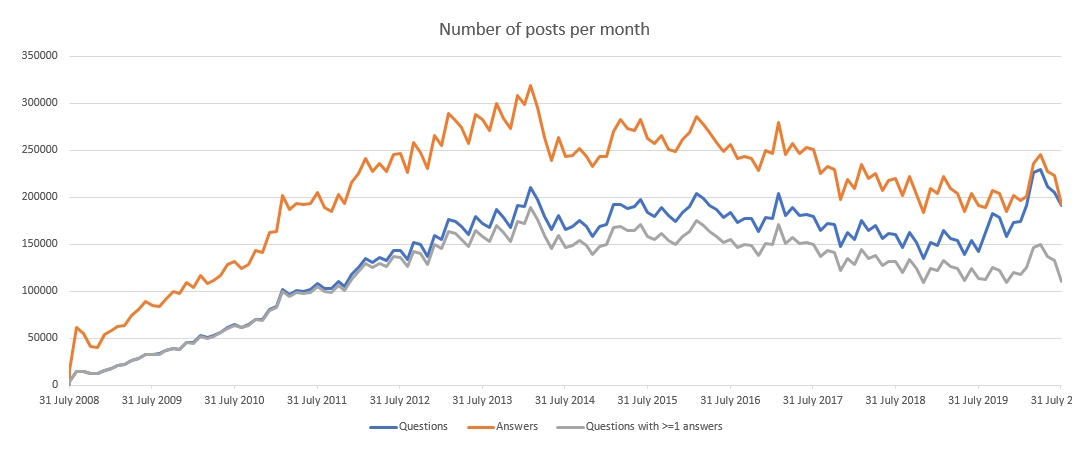
This graph shows the number of questions and answers posted every month. It also shows the number of questions which received at least one answer, though the answer didn’t have to be in the same month as the question. For this reason, older questions are slightly disproportionately more likely to have been answered. I don’t think this is likely to skew the data significantly, since questions tend to be most active in the period immediately after they were asked.
It’s possible for posts to have been deleted (e.g. if they’re off-topic). Deleted posts are not included. It’s likely that questions bad enough to be deleted would not receive any answers, so this omission is likely in StackOverflow’s favour.
The absolute numbers are not that important, though the steady decline in the number of answers since 2014 is slightly worrying. The more interesting thing to note here is the relative difference between each of the lines.
It’s easier to see the trend if we plot the ratios separately.
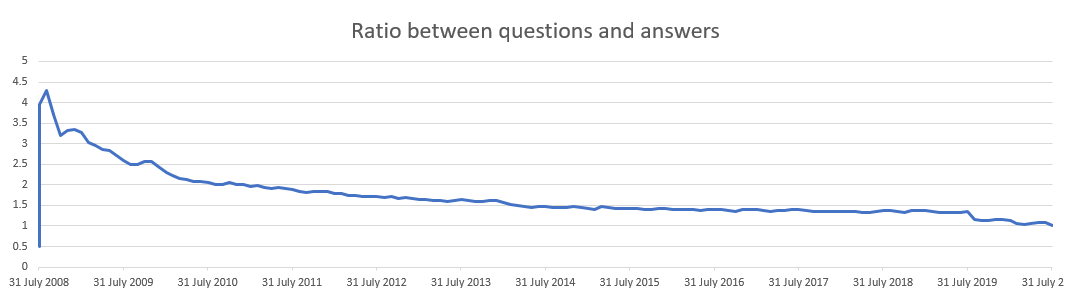
This shows the ratio of questions to answers, again grouped by month. In the early days, every question attracted, on average, four unique answers. That number is on course to drop below one for the first time in the website’s 12-year history. On a question and answer site, there will soon be more questions than answers.
It might seem intuitively that a ratio of 1:1 isn’t too bad. If every question gets one correct, concise and well-written answer, that’s the system working at optimal efficiency. No effort is wasted. The problem is that certain kinds of questions are bound to attract more answers than others. In reality, it’s far from a certainty that you’ll get an answer and, even if you do, that doesn’t mean it’s any good.
So what exactly are the odds that a question you post will receive an answer?
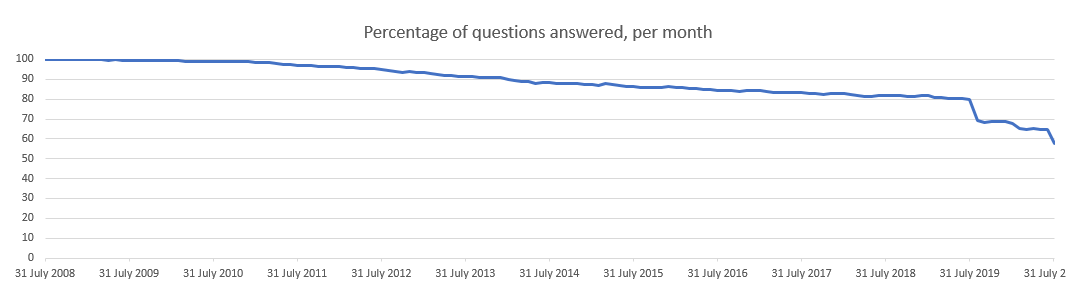
This shows the ratio of questions that were asked in a given month to those of which have at least one answer. Again, the answers could have come in the following months.
The 11% drop in one month is enormous but it’s accurate. It seems to be a manifestation of the community’s growing frustrations with the company’s decisions. In the second half of 2019, StackOverflow dreadfully mishandled a situation by firing a community-elected moderator and slandering them in the press. It’s possible that it was only the straw which broke the camel’s back, but it led to a mass exodus of established users, moderators and long-term staff.
Looking at how this has affected the likelihood of receiving an answer, a little over a year ago you had an 80% chance of getting an answer to your question. It’s now approaching a coin flip.
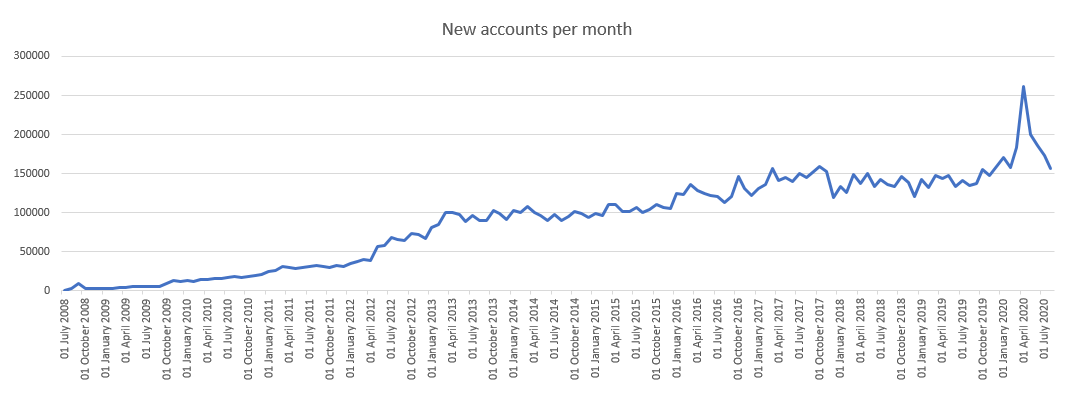
This shows the number of new accounts created each month.
Numbers! Going up! I’m sure that this chart is presented enthusiastically at the monthly board meetings, and that the execs around the table give themselves a big pat on the back because everything’s going so well.
I’d be hesitant to get excited about this. I don’t believe that StackOverflow’s model has proven that it’s able to scale with the number of users it pulls in. They make their money from ads, so whether a user is registered or not is mostly irrelevant. They want to be optimizing for page-views rather than engagement until they perfect the model, so that it’s actually able to scale with the number of users as they continue to grow.
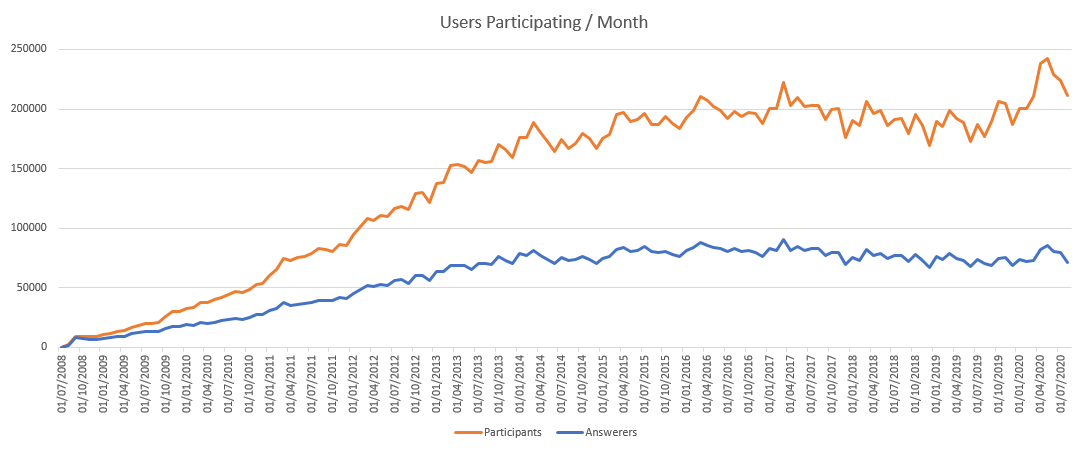
This graph shows the total number of users actively participating each month. I’ve defined participation as posting a comment, a question or an answer. For example, last month almost 212,000 users performed any one of those 3 activities — about 1.6% of their registered users — and only 71,000 of those answered a question.
Effectively only a third of users who are engaging at all are choosing to answer a question in any given month. That’s pretty bad but looks like it’s always been a similar ratio, even when the site seemed to function more smoothly. What surprised me was the relatively consistent number of people answering each month. It doesn’t align with the gradual decline in the percentage of new questions being answered. Perhaps the established users are not leaving completely but they’re just burnt out and are answering fewer and fewer questions.
So which users are answering questions? Is it the veterans or the young blood?
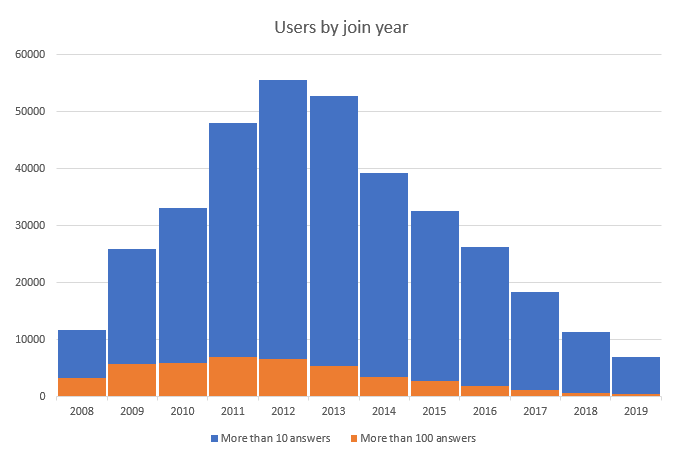
This chart shows the number of users with more than 10, and more than 100 answers, grouped by the year they joined. So of the users who joined in 2012, more than 55,000 of them have answered more than 10 questions, and more than 6500 have answered more than 100.
Of course, users who have been a member of the site for longer have had longer to reach the lofty heights of 10 answers, so you might expect some weighting towards the left-hand side, but there’s also more new joiners every year, as we’ve already seen. It’s more interesting to show these as a percentage of the number of users who joined that year.
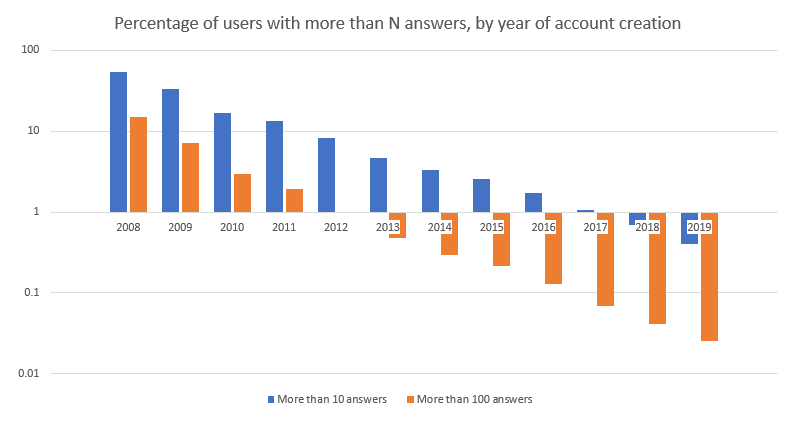
Careful with the scale here because it’s logarithmic. 54% of the class of 2008 have answered more than 10 questions, and 15% have answered more than 100. Compare that to 2019’s cohort and things are looking pretty dismal: 0.4% have answered more than 10 and only 0.02% have answered more than 100. A feat that would require the equivalent of posting an answer every 3 days was achieved by only 500 of the 1.7 million new users in 2019.
I understand why. If I’d joined for the first time last year, I probably wouldn’t bother either. The only reason I post now is out of habit, and much less than I used to. If the quality of questions is generally awful, what incentive is there to answer them?
![]()
Finally, I’d like to take a look at gold badge holders. A gold badge is the closest thing StackOverflow has to certify a user as an expert in a given domain. They’re awarded for individual tags (i.e. per language, framework or technology), when a user has accrued 1000 upvotes across 200 or more answers.
For the site to be working properly, they need to be attracting experts who are capable of giving precise answers to complex questions. They need to be doing this continually to replace those who leave, and preferably in-line with the increased volume of questions.
As you may have expected from the number of new users choosing to answer questions, this is not the case. The above graph shows the number of holders of the gold Java badge over time. Other tags showed a similar trend, but Java is one of the most common and also the one I have, so that’s why I chose to show that one. I added a polynomial trend line, mostly just to show off my Excel skills. I hope you’re sufficiently impressed but if you’re not then you can ignore it if you want. I’m really no statistician, and it does appear to be defying the overall trend more recently.
In any case, the number of holders is clearly not accelerating. You can never lose a badge once it’s been awarded and many of those awarded them have long since left. Of those 600 individuals, I could count on my fingers those who seem to be regularly active.
These trends are worrying but the most worrying thing is that it seems like no action is being taken to change course. I don’t believe StackOverflow’s platform is particularly special in terms of technology. It’s hardly changed in years and could be easily knocked off. Although they manage to sell an enterprise version, I can’t see why anyone would pay for it. They don’t own the content that people have contributed, though that didn’t stop them trying to unilaterally relicense it as though they do.
Their greatest asset has always been the community of developers they foster and the expertise that community can share. They should be doing everything in their power to hold onto that and they aren’t. The problem with providing a service to developers is that if they don’t like the direction you’re going, they’ll just leave and make their own version, and that’s exactly what some users are doing.